For installation, set-up and basic usage refer to the package README.md file. In this tutorial, you will find more context on package inputs, how to interact with package functions and interpret package outputs.
Preparing for mapping
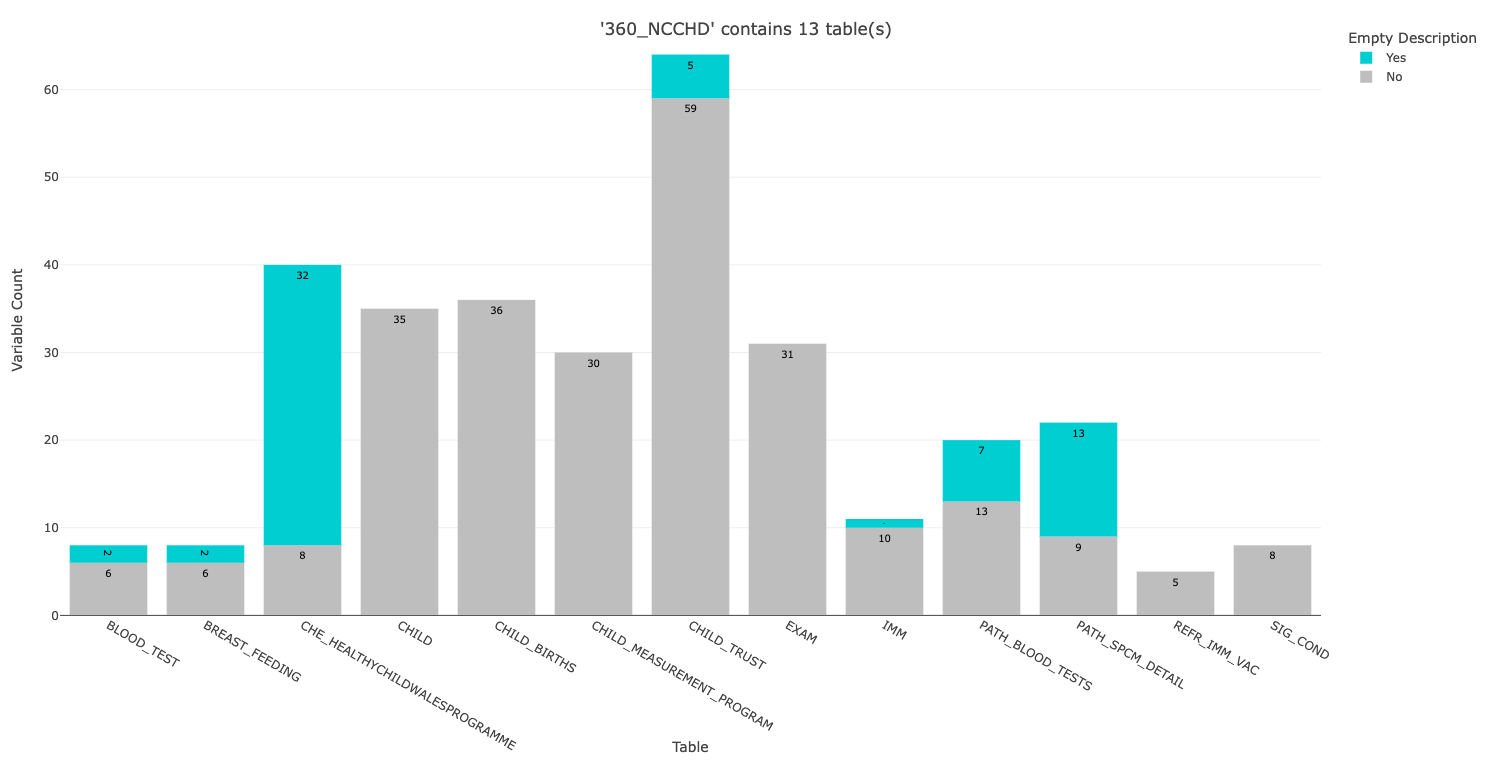
This bar plot is produced automatically when you run the metadata_map function with the demo metadata file, which contains metadata about the National Community Child Health Database (NCCHD).
The bar plot shows us there are 13 tables in the dataset. The height of the bar indicates the number of variables in that table:
- The ones with lots of variables (e.g. CHILD_TRUST) will take you longer to process (caveat: see HDRUK Gateway screenshot below)
- Some tables (e.g. CHE_HEALTHYCHILDWALESPROGRAMME) have a lot of empty descriptions. An empty description means that this variable will only have a label and a data type.
It is important to note that this plot is only summarising variable level metadata i.e. a description of what the variable is. Some variables also require value level metadata i.e. what does each value correspond to, 1 = Yes, 2 = No, 3 = Unknown. This value level metadata can sometimes be found in lookup tables, if it is not provided within the variable level description.
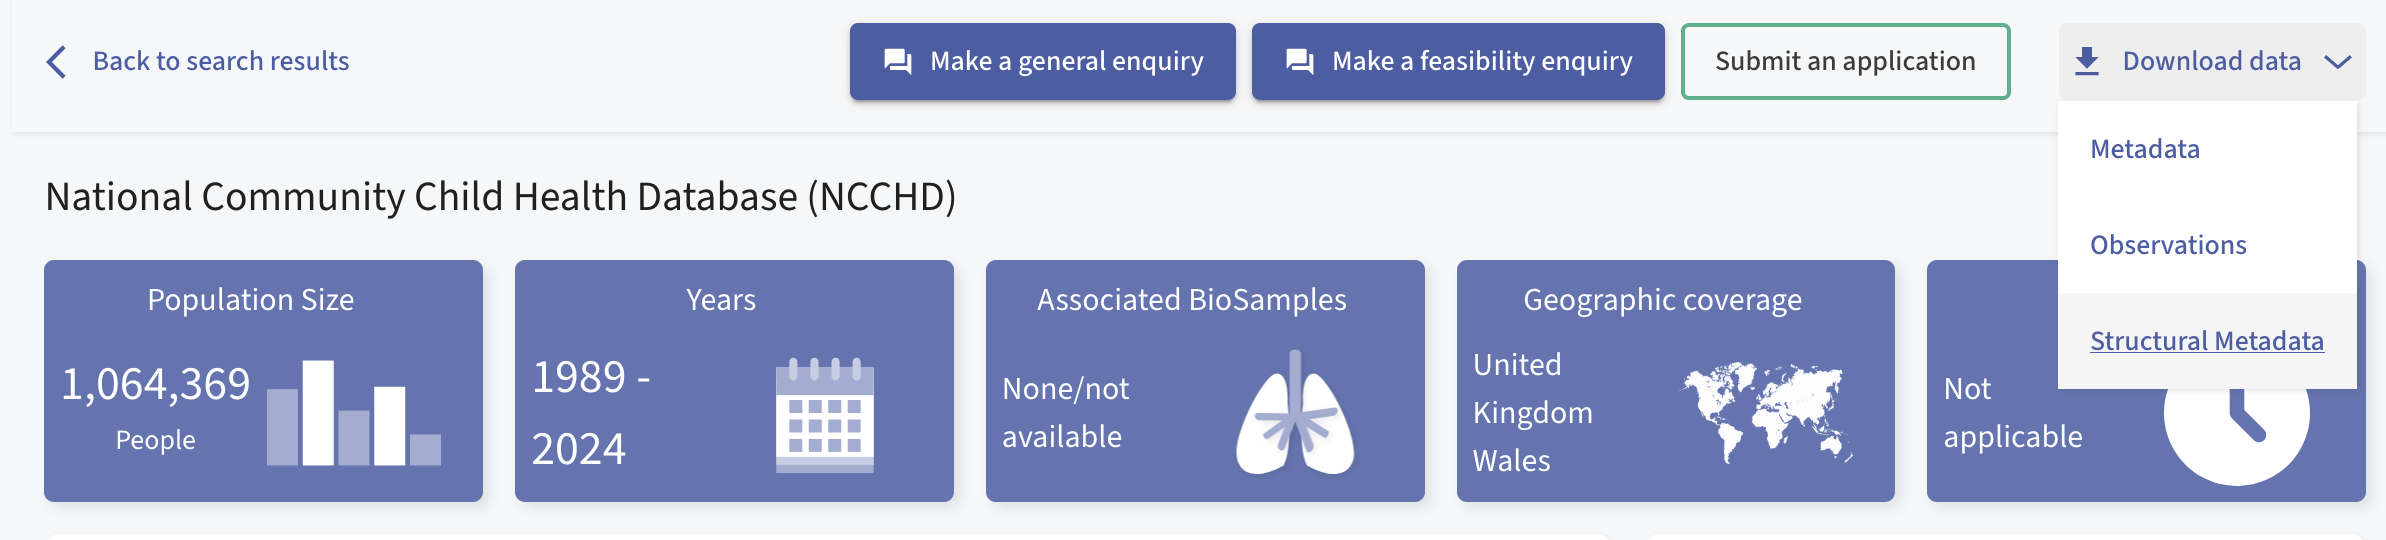
The bar plot can help you understand the scope of the dataset, but reference the HDRUK Gateway page for the fuller context. For instance, table descriptions are not included in these structural metadata files but they are included on the gateway:
For dataset NCCHD, used in the demo, the structural metadata was downloaded from https://healthdatagateway.org/en/dataset/360. Below, we include a screenshot of this page; a user must click on the ‘Download Data’ then ‘Structural Metadata’ in order to download the file. Please note, we are working on API integration with this package to streamline this for users.
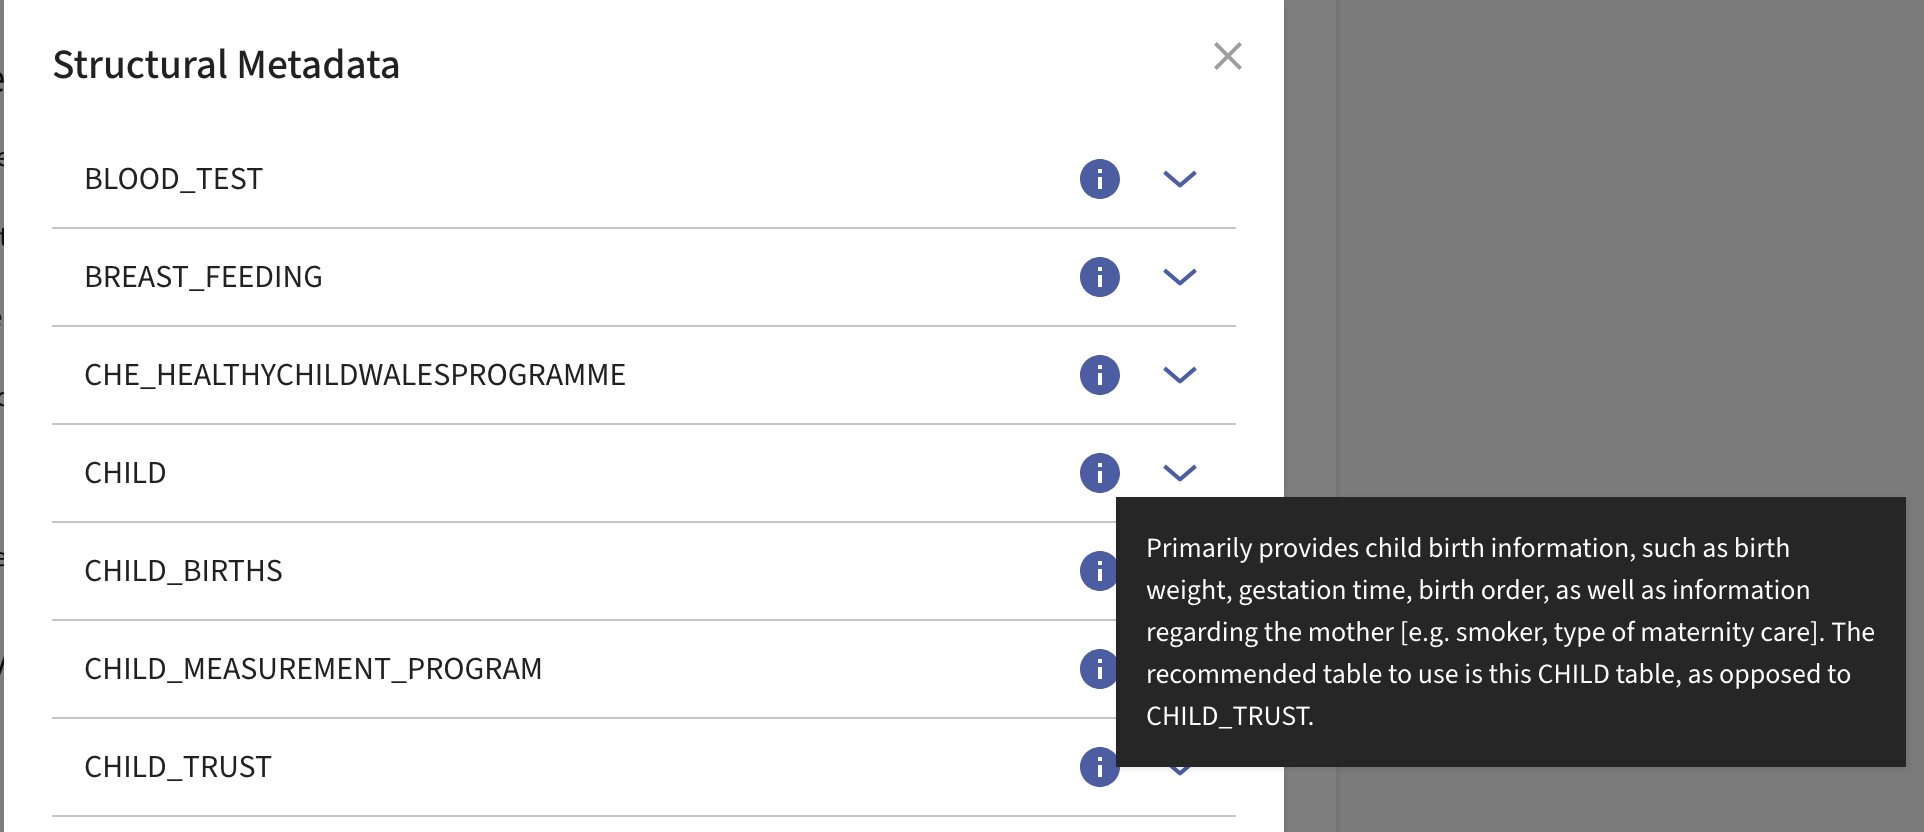
It is recommended to view the descriptions of each table to give you more context on their contents and how to use them:
Understanding mapping outputs
Running metadata_map will run this function in demo mode (as explained in the README) and generate six files in your project directory.
By default, the demo mode processes the first 5 variables in a table.
Running metadata_map(demo_number = 20) will process the
first 20 variables in a table. Here you can view
outputs generated from this longer demo run, which include:
-
BAR_360_NCCHD_timestamp.png
- The bar plot that opened in your browser. It will save as a .html file but you can choose the ‘Download plot as png’ option.
-
BAR_360_NCCHD_timestamp.csv
- The data that created this bar plot.
-
MAPPING_360_NCCHD_CHILD_timestamp.csv
- The mappings between variables in the CHILD table and the research domains.
-
L-MAPPING_360_NCCHD_CHILD_timestamp.csv
- The same mappings as the previous file, but saved in a longer
format. See the argument
long_output = TRUEin metadata_map. Iflong_output = FALSEwas used, the long outputs can be generated by directly calling the map_convert function.
- The same mappings as the previous file, but saved in a longer
format. See the argument
-
MAPPING_LOG_360_NCCHD_CHILD_timestamp.csv
- A log file that accompanies the MAPPING file, describing features of the session and the table processed.
-
MAPPING_PLOT_360_NCCHD_CHILD_timestamp.png
- A simple visual representation of the mappings, displaying the count of each domain code.
Compare mapping
Running the function map_compare will allow you to compare the mappings from two sessions, perhaps two different researchers. This function compares csv outputs from two sessions, finds their differences, and asks for a consensus, creating a new output file:
CONSENSUS_MAPPING_360_NCCHD_CHILD_timestamp.csv
Using a custom metadata input (recommended)
Currently, the way to retrieve a metadata file that is compatible with this package is to:
- Visit the Health Data Research Gateway website
- Browse for the dataset you want, click on it to move to its main page
- Click on ‘Download data’ button and select ‘Structural
Metadata’
- Rename this file to be ‘ID_Name_Metadata.csv’ with ‘ID’ and ‘Name’ being changed depending on the specific dataset download
The demo metadata file used in this package is 360_NCCHD_Metadata.csv, with 360 being the ID given by HDRUK Gateway and NCCHD being the abbreviation for the dataset name (National Community Child Health Database).
Any metadata file in the same format as this download should work with this package.
Run data("metadata") to load the demo metadata into your
R environment. This demo metadata is also included as a package file and
is retrieved using the system.file() function:
ncchd_metadata_csv <- system.file("inputs/360_NCCHD_Metadata.csv", package = "mapmetadata")
demo_domains_csv <- system.file("inputs/domain_list_demo.csv", package = "mapmetadata")
metadata_map(metadata_file = ncchd_metadata_csv, domain_file = demo_domains_csv)
Using a custom domain list input (recommended)
You can use a custom domain list input instead of using the default,
e.g. metadata_map(metadata_file = ID_Name_Metadata.csv, domain_file = my_domain_list.csv).
Run data("domain_list") to load the demo domain list
into your R environment (you can also read the package file with
system.file("inputs/domain_list_demo.csv", package = "mapmetadata").
data("domain_list")
print(domain_list, row.names = FALSE)
Domain_Code        Domain_Name
           1  NO MATCH / UNSURE
           2           METADATA
           3                 ID
           4       DEMOGRAPHICS
           5 Socioeconomic info
           6      Location info
           7     Education info
           8        Health info
Change this csv domain file to be more specific to your research domains (sometimes called latent variables or concepts) as these are broad and generic categories for demo purposes.
It is recommended to keep the first four domains (NO MATCH / UNSURE, METADATA, ID, DEMOGRAPHICS) as they map to the demo lookup table, but this is not essential.
Using a custom lookup table input (advanced)
Run data("look_up") to load the demo look up table into
your R environment (you can also read the package file with
system.file("inputs/look_up.csv", package = "mapmetadata")).
data("look_up")
print(look_up, row.names = FALSE)
                    Variable       Domain_Name
                        <NA> NO MATCH / UNSURE
               AVAIL_FROM_DT          METADATA
                       ALF_E                ID
                MOTHER_ALF_E                ID
                 CHILD_ALF_E                ID
                        RALF                ID
                  ALF_STS_CD                ID
           MOTHER_ALF_STS_CD                ID
            CHILD_ALF_STS_CD                ID
                ALF_MTCH_PCT                ID
         MOTHER_ALF_MTCH_PCT                ID
          CHILD_ALF_MTCH_PCT                ID
     SERVICE_USER_LOCAL_ID_E                ID
 MAT_SERVICE_USER_LOCAL_ID_E                ID
                 CLIENT_ID_E                ID
                         AGE      DEMOGRAPHICS
                     MAT_AGE      DEMOGRAPHICS
              MAT_AGE_AT_ASS      DEMOGRAPHICS
                 CONTACT_AGE      DEMOGRAPHICS
                         WOB      DEMOGRAPHICS
                     MAT_WOB      DEMOGRAPHICS
                         SEX      DEMOGRAPHICS
         SERVICE_USER_SEX_CD      DEMOGRAPHICS
             NENONATE_SEX_CD      DEMOGRAPHICS
                      GENDER      DEMOGRAPHICS
                        GNDR      DEMOGRAPHICS
                     GNDR_CD      DEMOGRAPHICS
The default lookup table (printed above) governs the automatic categorisations within the metadata_map function:
- When a variable needs to be mapped to a domain, before asking the user it searches the lookup table
- If the variable name is contained within the ‘Variable’ column of the lookup table, this triggers the auto-categorisation
- For this variable, the Domain_Name is extracted from the lookup table and the Domain_Code from the domain_list (therefore for a variable to be auto-categorised there must be a matching Domain_Name in the lookup and the domain_list files)
When creating a custom lookup table, you can use this lookup table as a base and just append new rows to the bottom. Alternatively, if you do not want variables to be automatically mapped in the way defined by this lookup table, you can delete the rows for those specific variables. Remember, you will always have the opportunity to review the variables that have been auto-categorised, and change the mapping decision as needed.
Copying across tables
If you’re processing multiple tables (i.e. in run one of metadata_map select table one, in run two select table two) save all outputs in the same directory to enable table copying. This feature will speed up categorisation and ensure consistency. If it finds other MAPPING files with the same ID_Name in the output directory, and they contain overlapping variables, it will automatically copy the mappings from this previous table to the current table.
Selection: 4
ℹ Processing Table 4 of 13 (CHILD)

ℹ Copying from previous session(s): MAPPING_360_NCCHD_BLOOD_TEST_2025-02-14-18-14-01.csv
Instead of ‘AUTO CATEGORISED’ the note will say ‘COPED FROM:
BLOOD_TEST’ but you always have the option to manually override this
copying during your review, or turn it off altogether with the option
table_copy = FASLE.